This Tutorial will teach you how to make the Sales Chart using php and mysql. In order to create the project i have used editor as PHPStrom.
First Step Establish the Database Connection
Create the Page db.php.
<?php

$servername = "localhost";
$username = "root";
$password = "";
$dbname = "salesdb";


$conn = mysqli_connect($servername,$username,$password,$dbname);

?>
After that design the index page.
Index.php
<?php
include("db.php");
$query = "select jan,feb,march,april,may,june,july from saleschart";
$result = mysqli_query($conn,$query);
if(mysqli_num_rows($result) >= 1) {
while ($row = mysqli_fetch_assoc($result)) {
$jan = $row['jan'];
$feb = $row['feb'];
$march = $row['march'];
$april = $row['april'];
$may = $row['may'];
$june = $row['june'];
$july = $row['july'];
}
}
else
{
echo "somting went wrong";
}
?>
<html>
<head>
<link href="https://cdnjs.cloudflare.com/ajax/libs/Chart.js/2.8.0/Chart.css" rel="stylesheet">
<link href="https://cdnjs.cloudflare.com/ajax/libs/Chart.js/2.8.0/Chart.min.css" rel="stylesheet">
</head>
<body>
<canvas id="myChart" style="height: auto; width: 500px;"></canvas>
<?php
echo "<input type='hidden' id= 'jan' value = '$jan' >";
echo "<input type='hidden' id= 'feb' value = '$feb' >";
echo "<input type='hidden' id= 'march' value = '$march' >";
echo "<input type='hidden' id= 'april' value = '$april' >";
echo "<input type='hidden' id= 'may' value = '$may' >";
echo "<input type='hidden' id= 'june' value = '$june' >";
echo "<input type='hidden' id= 'july' value = '$july' >";
?>
<script src="https://cdnjs.cloudflare.com/ajax/libs/Chart.js/2.8.0/Chart.bundle.js"></script>
<script src="https://cdnjs.cloudflare.com/ajax/libs/Chart.js/2.8.0/Chart.bundle.min.js"></script>
<script src="https://cdnjs.cloudflare.com/ajax/libs/Chart.js/2.8.0/Chart.js"></script>
<script src="https://cdnjs.cloudflare.com/ajax/libs/Chart.js/2.8.0/Chart.min.js"></script>
<script>
var jan = document.getElementById("jan").value;
var feb = document.getElementById("feb").value;
var march = document.getElementById("march").value;
var april = document.getElementById("april").value;
var may = document.getElementById("may").value;
var june = document.getElementById("june").value;
var july = document.getElementById("july").value;
window.onload = function()
{
var randomScalingFactor = function() {
return Math.round(Math.random() * 100);
};
var config = {
type: 'bar',
data: {
borderColor : "#fffff",
datasets: [{
data: [
jan,
feb,
march,
april,
may,
june,
july
],
borderColor : "#fff",
borderWidth : "3",
hoverBorderColor : "#000",
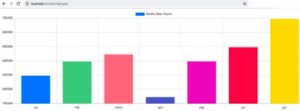
label: 'Monthly Sales Report',
backgroundColor: [
"#0190ff",
"#56d798",
"#ff8397",
"#6970d5",
"#f312cb",
"#ff0060",
"#ffe400"
],
hoverBackgroundColor: [
"#f38b4a",
"#56d798",
"#ff8397",
"#6970d5",
"#ffe400"
]
}],
labels: [
'Jan',
'Feb',
'March',
'April',
'May',
'June',
'July'
]
},
options: {
responsive: true
}
};
var ctx = document.getElementById('myChart').getContext('2d');
window.myPie = new Chart(ctx, config);
};
</script>
</body>
</html>i have attached the video link below. which will do this tutorials step by step.